menu
close

Author(s):

Chiara Osbat | European Central Bank (ECB)

Keywords:

Prices , Inflation , web-scraping

JEL Codes:

D22 , E31 , E37

This policy brief isbased on contributions by Lukas Henkel, Bruno Fagandini, Bernhard Goldhammer, Teresa Messner, Fabio Rumler, Pawel Macias, Damian Stelmasiak and Karol Szafranek.

PRISMA is a research network set up by the European System of Central Banks. It was established to deepen the understanding of price-setting behavior and inflation dynamics in the EU, with a view to gaining new insights into this key element of monetary policy transmission. It collects and studies various kinds of microdata: Official data underlying official price indices (CPI and PPI), scanner data and online prices. These sources are very complementary, each has advantages and disadvantages.1

Online data offer advantages over standard statistical series. One of the advantages is that they are available at high frequency: Typically daily, but in principle prices can be scraped also intradaily, for example to study dynamic pricing. Online data are also timely: Yesterday’s data are available for analysis today. They are precise, as they report the price of a given product rather than unit values as in scanner data. In addition, online data also include metadata (e.g. if a price is discounted) as well as product and shop characteristics and have large coverage for a given shop (prices for all products available on a given website can be collected).

However, online data also have disadvantages. One of them is that that they are not always representative. Some online shops refer to a specific zip code, and dynamic pricing makes it possible to even tailor the price to a specific customer or category of customers, e.g. those accessing the shop from specific kinds of mobile devices. This is not only a problem with online price data: Big data in general are not collected according to the principles of statistical sampling used in surveys so they cannot support inferential statements on the reference population. The ad-hoc nature of their collection can induce various biases. Selection bias may result from the self-selection of retailers that are present online, e.g. in the case of food, large distributors will be sampled but corner shops will not. The choices the researcher makes when deciding which data to web-scrape can also induce biases. Furthermore, not all products are sold online. Another disadvantage of online data is the effort needed to harmonize the collected data. The information contained on each website is non-homogeneous (each website contains different information, and when the scraping is done in “bulk”, the products must be classified and mapped to a common classification system). The large quantity of information makes these data richer, also in terms of information that can be used for classification, but also challenging to manage.

Web-scraped data is far from a few clicks away: Scraping itself has become largely a commodity service, but analyzing these data involves a substantial investment in pre-processing. As a first step, conceptual definitions are necessary, i.e. a harmonized data model has to be created and meaningful aggregation rules have to be developed. Then a pipeline for collecting, validating and storing the data and metadata must be established, together with a process and code for monitoring the daily data flow in the most automated way possible.

An important part of the data pipeline is the classification to a common classification system (European Classification of Individual Consumption according to Purpose – ECOICOP). This has an analytical aspect, which involves developing artificial intelligence (AI) classifiers that can handle multilingual information. For this purpose, resources are also needed to manually classify a training sample for each language. In addition to the scientific aspect of developing multilingual classifiers, such as the method proposed by Lehman et al. (2020), there are the machine learning operations (MLOPs) aspects of continuously developing, monitoring, maintaining and deploying the classifiers.

Once we have put the data in a structured form based on the appropriate data model, how can we use them? Web-scraped data have been used for research on price-setting (Cavallo, 2018), on nowcasting (see Powell et al., 2018; Macias et al., 2022) and to investigate aspects of inflation measurement (see e.g. Cavallo, 2013). These uses were very well explained and documented in Cavallo and Rigobon (2016).

The data can also be used to monitor inflation, both as regards understanding current macroeconomic developments and detecting behavioral changes. In particular, a change in the price-setting behavior of firms could be expected in times of large cost shocks as observed since 2021, and would give rise to a nonlinear response of consumer price inflation.

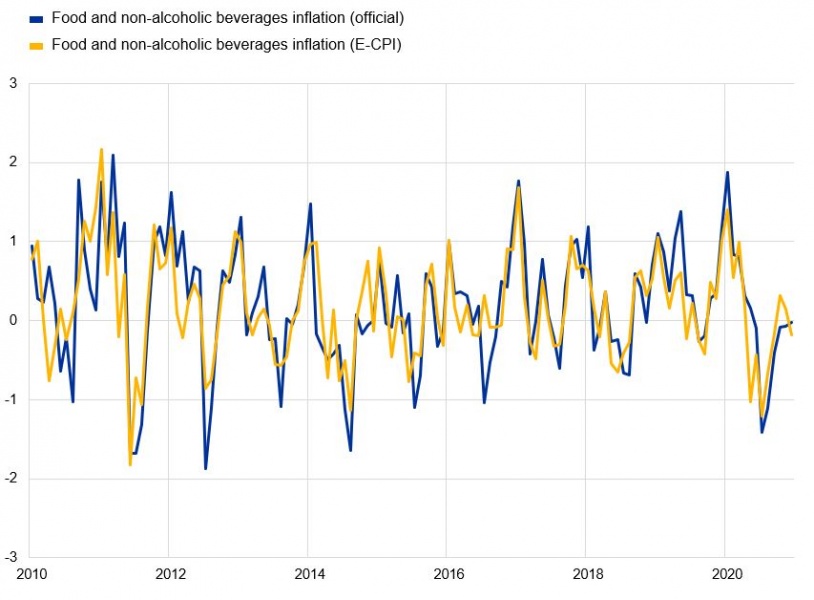
On nowcasting, in their 2022 paper entitled “Nowcasting food inflation with a massive amount of online prices,” PRISMA network members Macias, Stelmasiak and Szafranek found that using online data led to a substantial and statistically significant reduction in the nowcasting errors with respect to popular benchmarks, and that having a large volume of data helps to improve performance but a lot of work must go into the ECOICOP classification, the choice of products and the precise application of the official CPI methodology (see chart 1). They also found that during 2020 the accuracy of their baseline model increased with respect to the benchmark.

Chart 1: Comparison of official CPI and online prices (based on official product selection and aggregation, month-on-month %)

 width=

Source: Macias, Stelmasiak and Szafranek (2022). Note: E-CPI refers to the CPI compiled using online price data, as described by Macias et al. (2022).

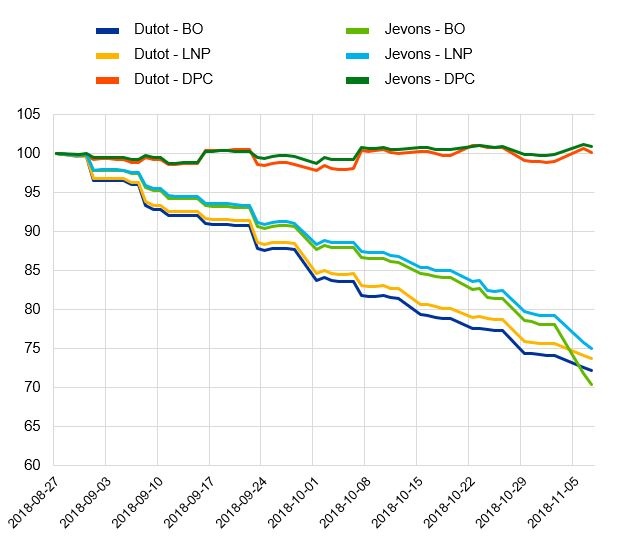
On inflation measurement, Goldhammer, Henkel and Osiewicz in their 2019 study “Bias related to the Bridged-overlap- and Link-to-Show-No-Price-Change Method” looked at the implications of using one of three implicit quality adjustment methods in the event of product replacements. They found that disregarding price changes at the time of replacement can lead to a downward drift in a price index. This points to the paramount importance of checking the assumptions underlying each method.

Chart 2: Test calculations for different quality adjustment methods (index, 27/08/2018 = 100)
 width=

Source: Goldhammer, Henkel and Osiewicz (2019). Notes: DPC: direct price comparison; LNP: link-to-show-no price change; BO: bridged overlap.

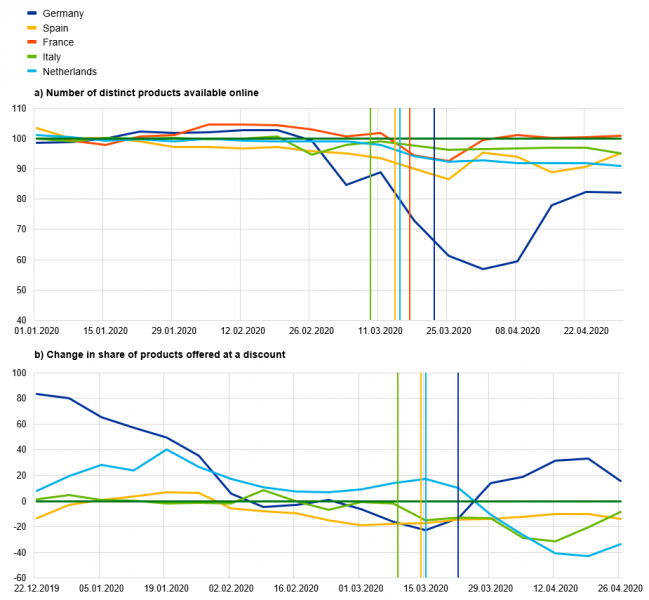
Web-scraped data have also been used to monitor inflation in real time, looking at special events such as the temporary VAT change in Germany, the stock-outs during the early stages of the COVID pandemic (see chart 3), and recently the price-setting behavior in periods of low and high inflation.

Chart 3: Number of distinct products available online by country and annual percentage change in the share of products offered at a discount (panel a: index, January 2020 = 100; panel b: year-on-year percentage changes)

 width=

Source: PriceStats, web-scraped price data. Notes: Reproduced from ECB. Economic Bulletin, Issue 1/2021. Microdata on online prices provided by PriceStats for one online supermarket per country. Panel a shows a weekly index of the number of products available online by country, computed as the ratio of the weekly median of the number of distinct products to the median number of products in January 2020. Panel b shows the 5-week moving average of the year-on-year percentage change in the weekly median of the share of products offered at a discount. France is excluded from the analysis of temporary discounts, as no information on temporary discounts was available from the French online supermarket. The vertical lines indicate the start of the country-specific lockdowns. Latest observations: April 30, 2020.

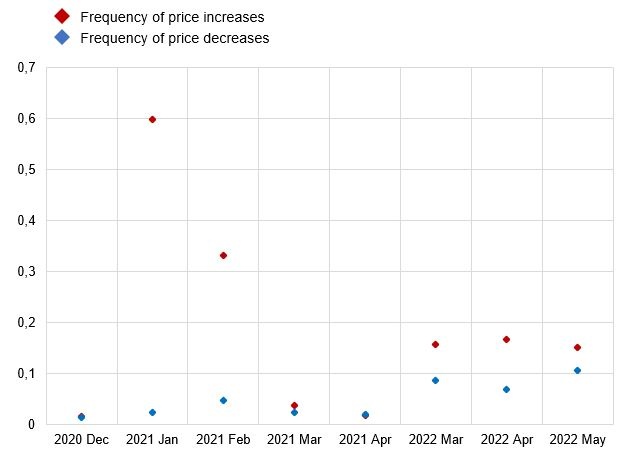
Using online data to look at the frequency and size of price changes by looking at different shops highlights an apparent change of behavior from 2021 to 2022 in terms of the frequency of price changes (see chart 4). Understanding what could drive this heterogeneity, for example in terms of market power, is a central question in understanding inflation dynamics.

Chart 4: Germany: frequency of price increases and decreases during VAT change and in 2022

 width=

Source: ECB staff calculations based on daily online price data. Notes: Web-scraped data from a German online supermarket. Products on sale are excluded. Latest observation: May 16, 2022

This is where the complementarity between online and scanner data shines: While online data are very timely and can point to interesting facts, scanner data are usually available with a lag of years but they contain much richer information that can help us to study heterogeneity in pricing behavior more deeply. For example, retailer scanner data contain information on the quantities sold in each shop of each kind of retailer, which allow to estimate price elasticities or to consider market shares.2 Household panels also contain information about who buys which products, shedding light on the heterogeneous behavior on the part of consumers and on the heterogeneity of experienced inflation across different demographics.

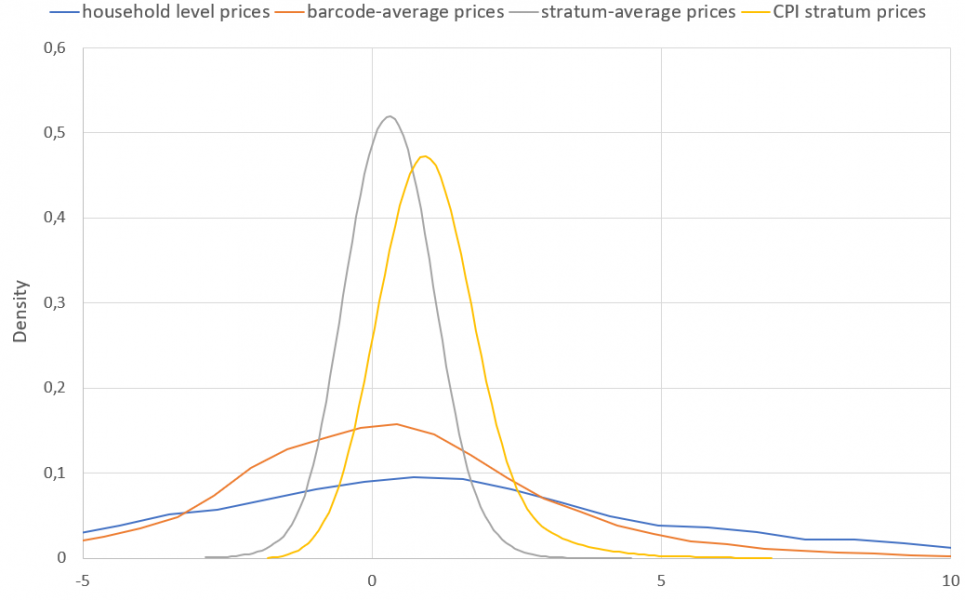
Analyzing household scanner data helps to understand the heterogeneity of experienced inflation across different demographics and countries. For example, in line with evidence for the United States (Kaplan and Schulhofer-Wohl, 2017, and Argente and Lee, 2021), PRISMA network members Messner and Rumler (2022) showed that Austrian households experience very heterogenous inflation rates, as shown in chart 5.

Chart 5: Distribution of Austrian household-level inflation rates in a typical quarter (Q4 2018)

 width=

Source: Messner and Rumler (2022). Notes: The chart compares the distributions of inflation rates using different sets of price information. Kernel density estimates using Epanechnikov kernel function with a bandwidth of 0.5 on 100 points. Data include 2,365 households with at least five matched barcodes between Q4 2017 and Q4 2018. The plot is truncated at -5% and 10%.

The chart shows the distribution of inflation rates across households together (in blue) next to counterfactual distributions that would arise if all households paid the average prices according to various strata, or the average price paid for each product variety (identified by barcode). The latter approximates the actual inter-household distribution best, showing that inflation heterogeneity results from differences in products bought and prices paid but cannot be fully explained by household characteristics, such as household income and size. In aggregate the study does find that lower-income households experience higher inflation rates when inflation is high, but the gap in inflation rates between lower- and higher-income households varies over time and is not always positive.

The conclusion of this short overview is that web-scraped data are very useful for monitoring inflation in real time, both for nowcasting and for observing changes in price-setting patterns. This in itself is very valuable, but online data also offer a laboratory to observe patterns and formulate research questions that can then be answered by other kinds of data, such as those contained in retailer or household scanner datasets.

References

Cavallo, A. 2013. Online and official price indexes: Measuring Argentina’s inflation. Journal of Monetary Economics 60 (2). 152–165.

Cavallo, A. 2018. Scraped Data and Sticky Prices. Review of Economics and Statistics 100 (2018). 105–119.

Cavallo, A. and R. Rigobon. 2016. The Billion Prices Project: Using Online Prices for Measurement and Research. Journal of Economic Perspectives 30 (2). 151–78.

Dedola, L., C. Osbat and T. Reinelt. 2022. Tax thy neighbour: Corporate tax pass-through into downstream consumer prices in a monetary union. ECB Working Paper Series, forthcoming.

Goldhammer, B., L. Henkel and M. Osiewicz. 2019. Bias related to the Bridged-overlap- and Link-to-Show-No-Price-Change Method. Poster presented at the 16th Meeting of the Ottawa Group on Price Indices, Rio de Janeiro. 2019.

Lehmann, E., A. Simonyi, L. Henkel and J. Franke. 2020. Bilingual Transfer Learning for Online Product Classification. In: Proceedings of Workshop on Natural Language Processing in E-Commerce. 21–31. Barcelona, Spain. Association for Computational Linguistics.

Macias, P., D. Stelmasiak and K. Szafranek. 2022. Nowcasting food inflation with a massive amount of online prices. International Journal of Forecasting.

Powell, B., G. Nason, D. Elliott, M. Mayhew, J. Davies and J. Winton. 2018. Tracking and modelling prices using web‐scraped price microdata: towards automated daily consumer price index forecasting. Journal of the Royal
Statistical Society Series A. Royal Statistical Society, vol. 181(3). 737–756.

About the authors

Chiara Osbat

Chiara Osbat is Adviser in the Directorate General Economics/Prices and Costs Division of the European Central Bank. Her research interests are in the area of inflation, exchange rate determination and transmission and quantitative methods. She holds a PhD from the European University Institute.

More on these topics

Tags: