The views, opinions, findings, and conclusions or recommendations expressed in this paper are strictly those of the authors. They do not necessarily reflect the views of the Swiss National Bank (SNB). The SNB takes no responsibility for any errors or omissions in, or for the correctness of, the information contained in this paper.
Private consumption, i.e., spending of households, is a key economic variable, but disaggregated data on household spending are scarce, especially in panel form. In our recent study (Galli and Rosenblatt-Wisch, 2022), we fill this gap for Switzerland by imputing consumption estimates from tax data, obtaining a detailed panel of income streams and wealth components for all individual taxpayers in the Swiss Canton of Bern between 2002 and 2016. We show how to transform tax-specific data and information into economically interpretable measures and use resulting consumption estimates to analyse households’ consumption and saving patterns. When correcting for period and cohort effects we find the typical hump-shaped consumption profile over the life cycle and an increasing saving rate over the working age with a substantial fall with retirement and dissaving thereafter. The data at hand also allows analysing consumption and saving patterns across different household groups as well as developments in inequality.
Consumer spending is a key variable for economic analysis. The necessity of having high-quality consumption measures has been discussed by, e.g., Browning, Crossley, and Weber (2003), Carroll, Crossley, and Sabelhaus (2015) and Pistaferri (2015). While aggregate data on private consumption expenditure are commonly available from a country’s national accounts, information on a disaggregated level is much harder to retrieve. However, to be able to account for heterogeneity in consumption patterns across households or to conduct life-cycle analyses, such data are indispensable.
There are two main sources to obtain such detailed information on consumption: a) household surveys and b) administrative data, e.g., data from tax records. Compared to administrative data, surveys may have advantages in terms of consistency of the covered entities (households), economical interpretation of the data, granularity with respect to the different consumption components, and potentially geographical coverage. However, survey data also come with two major drawbacks. First, the sample size of surveys is usually rather small, which substantially limits the potential scope and depth of the analysis. Second, most of the time, survey data are of cross-sectional rather than panel structure and therefore do not allow us to observe consumption patterns of the same entity over time.
In Galli and Rosenblatt-Wisch (2022), we therefore impute consumption from tax records. We obtain a detailed panel of consumption spending, income streams and wealth components, which covers all individual taxpayers in the Swiss Canton of Bern between 2002 and 2016. The Canton of Bern is, measured by its population, the second largest canton of Switzerland and covers both urban and rural areas, similar to Switzerland as a whole. Swiss tax data have already been used in other studies, e.g., Brülhart, Gruber, Krapf, and Schmidheiny (2016), Brunner, Meier, and Naef (2020) and Martínez (2021), where the focus lies on income and wealth.
Retrieving consumption measures from tax records is not straightforward, since consumption is not a variable directly asked for in the tax declaration. Our method to impute consumption from administrative records is based on the simple budget constraint of a household — consumption equals income minus savings — and is in line with existing research, e.g., Fagereng and Halvorsen (2017), Koijen, Van Nieuwerburgh, and Vestman (2014), or Browning and Leth-Peterson (2003). Since in the tax records income and wealth components are declared in tax- and country-specific ways, several adjustments and assumptions have to be made to retrieve measures of income and savings to finally calculate consumption. Validations of the imputed consumption estimates with a consumer expenditure survey and with data from the official national accounts suggest that our retrieved consumption estimates are highly plausible.
Based on our consumption estimates, we analyse consumption and saving patterns over the life cycle. Figure 1 shows the median consumption age profile (left chart) and median saving rate age profile (right chart). In a first step, we simply pool all individuals (red lines). The results based on these pooled cross sections indicate that consumption increases steeply at younger age and reaches a peak between 40 and 50. Already before the age of retirement, consumption starts to decrease. This downwards tendency then intensifies with retirement. The resulting hump-shaped consumption age profile is well in line with, e.g., Browning and Crossley (2001), Deaton (1991) or Carroll (1994). In terms of saving patterns, the pooled cross-section analysis suggests that the median saving rate is quite stable over the working age. With retirement and the associated reduction in disposable income, the median saving rate decreases substantially and becomes negative, i.e., households start dissaving at the median. Dissaving is strongest immediately after retirement and lessens somewhat afterwards with aging. One reason might be that older people become restricted in their consumption possibilities and therefore consume less and less.
Figure 1: Consumption over the life cycle using the intrinsic estimator
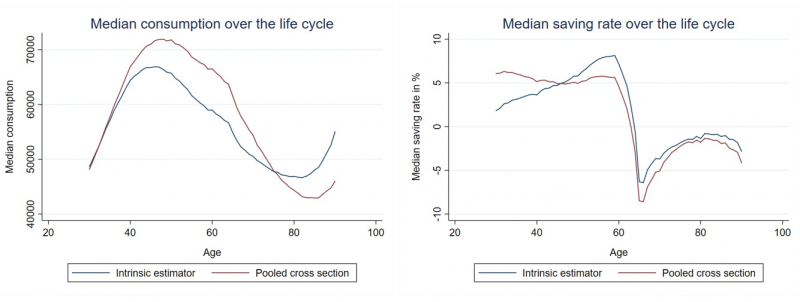
Consumption and saving age profiles based on simple pooled cross sections may be affected by so-called cohort as well as period effects. Cohort effects imply that consumption of a particular cohort is systematically higher or lower for any age compared to other cohorts. Period effects imply that in a particular year, consumption is systematically higher or lower for all households compared to other years. Thus, in a second step, we try to correct the consumption and saving age profiles for such effects by applying the intrinsic estimator for age-period-cohort analysis, proposed by Fu (2000) and further outlined in Yang, Schulhofer-Wohl, Fu, and Land (2008). The results in Figure 1 show that when adjusting for cohort and period effects (blue lines), the peak in consumption over the life cycle is reached earlier and the decrease in consumption around the age of retirement is less drastic than the pooled cross-section analysis indicates. The saving rate adjusted for period and cohort effects is actually increasing over the working age. This result is in line with, e.g., Bebczuk, Gasparini, Garbero, and Amendolaggine (2015). They find, that the saving rate should be highest among working adults versus individuals at both tails of the age distribution.
An advantage of the data at hand is that it allows for analysis across different household groups (cf. Figure 2). The top charts show median consumption and the median saving rate of the lowest, middle and highest income quintiles for each age.2 Not surprisingly, consumption is highest for the highest income quintile and lowest for the lowest income quintile. Furthermore, consumption depends more on age for middle and high incomes than for low incomes. In terms of savings, the top right chart indicates that the saving rate of higher-income households is systematically higher than the one of lower-income households and that the saving rate is increasing over the preretirement life cycle for all three income quintiles. The latter finding supports the view that the divergence in the dynamics of consumption over the working age between low-income and middle/top-income households is due to differences in income developments and not to consumption/savings decisions. A few years prior to the official retirement age, the saving rate starts to decrease for all three income quintiles — potentially driven by early retirements — and reaches its trough around the official retirement age.
The bottom chart of Figure 2 shows the difference in the median saving rate between property owners and non-property owners. Before retirement, the saving rate of property owners is clearly above that of non-property owners. After retirement, however, the saving rates of the two household groups are very similar and drop below zero for both groups.
Figure 2: Consumption and savings over the life cycle for different household groups
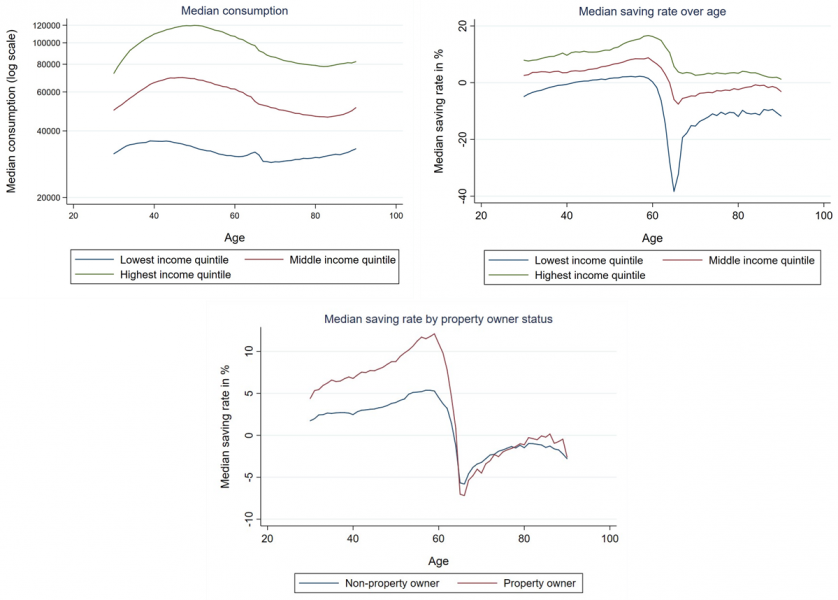
Note: All data adjusted for cohort and period effects.
In our paper, we also analyse inequality in consumption and income. We find evidence that, over the life cycle, consumption and income inequality are rather low at a young age but increase thereafter. On aggregate, however, consumption and income inequality remained rather stable between 2002 and 2016.
Bebczuk, R., L. Gasparini, N. Garbero, and J. Amendolaggine (2015): “Understanding the Determinants of Household Saving: Micro Evidence for Latin America,” CEDLAS, Working Papers 0189, CEDLAS, Universidad Nacional de La Plata.
Brülhart, M., J. Gruber, M. Krapf, and K. Schmidheiny (2016): “Taxing Wealth: Evidence from Switzerland,” NBER Working Paper 22376, National Bureau of Economic Research.
Browning, M., and T. F. Crossley (2001): “The Life-Cycle Model of Consumption and Saving,” Journal of Economic Perspectives, 15(3), 3–22.
Browning, M., T. F. Crossley, and G. Weber (2003): “Asking consumption questions in general purpose surveys,” The Economic Journal, 113(491), F540–F567.
Browning, M., and S. Leth-Peterson (2003): “Imputing Consumption from Income and Wealth Information,” The Economic Journal, 113, F282–F301.
Brunner, M., J. Meier, and A. Naef (2020): “Heterogeneity in Returns to Wealth – Evidence from Swiss Administrative Data,” Available at SSRN: https://ssrn.com/abstract=3743616 or http://dx.doi.org/10.2139/ssrn.3743616.
CarrollC. D. (1994): “How Does Future Income Affect Current Consumption?,” Quarterly Journal of Economics, 109, 111–148.
Carroll, C. D., T. F. Crossley, and J. Sabelhaus (2015): Improving the Measurement of Consumer Expenditures. University of Chicago Press, Chicago.
Deaton, A. (1991): “Saving and Liquidity Constraints,” Econometrica, 59(4), 1221–1248.
Fagereng, A., and E. Halvorsen (2017): “Imputing consumption from Norwegian income and wealth registry data,” Journal of Economic and Social Measurement, (1), 67–100.
Fu, W. J. (2000): “Ridge Estimator in Singular Design with Application to Age-Period-Cohort Analysis of Disease Rates,” Communications in Statistics – Theory and Method, 29, 263–78.
Galli, A., and R. Rosenblatt-Wisch (2022): “Analysing households’ consumption and saving patterns using tax data,” Working Papers 2022-03, Swiss National Bank.
Koijen, R., S. Van Nieuwerburgh, and R. Vestman (2014): “Judging the quality of survey data by comparison with” truth” as measured by administrative records: evidence from Sweden,” in Improving the Measurement of Consumer Expenditures, pp. 308–346. University of Chicago Press.
Martínez, I. Z. (2021): “Evidence from Unique Swiss Tax Data on the Composition and Joint Distribution of Income and Wealth,” in Measuring Distribution and Mobility of Income and Wealth, NBER Chapters. National Bureau of Economic Research, Inc.
Pistaferri, L. (2015): “Household consumption: Research questions, measurement issues, and data collection strategies,” Journal of Economic and Social Measurement, (1-4), 123–149.
Yang, Y., S. Schulhofer-Wohl, W. J. Fu, and K. C. Land (2008): “The Intrinsic Estimator for age-period-cohort analysis: what it is and how to use it,” American Journal of Sociology, 113(6), 1697–1736.
Note, that income refers to income in a specific year and not to life-time income.