This brief is available in a longer format as a National Bank of Slovakia policy brief: https://nbs.sk/dokument/24aa1832-d652-4812-a1c4-63d4caa7802d/stiahnut?force=false.
Markups for firms operating in food and beverages manufacture and sale sectors have increased in the first half of 2022, suggesting a decoupling between the increase in current production costs and prices. The evolution of markups in the period between the first quarter of 2015 and the second quarter of 2022, a high-inflation environment, shows a recent change in the price setting behaviour displayed by food-related businesses.
Is the recent acceleration of inflation driven by global cost dynamics or have Slovak manufacturers and retailers been unjustifiably increasing their prices beyond the cost pressures they face? We examine the price setting behaviour of firms in Slovakia with a focus on food and beverages sectors stemming from their apparent idiosyncrasies: firms operating in these sectors have showed clear signs of increase in markups, leading food prices to be a key driver of overall inflation in Slovakia in 2022. We provide different interpretations of our findings, among which the possibility of a gradual regime shift in firms’ price setting behaviour materializing in an increase in markup volatility.
Food is a basic necessity and one of the main drivers of the recent HICP inflation surge in Slovakia. The median Slovak household declares to spend about 26% of their income, almost 10% more than the EA average, to purchase food. In October 2022 food prices accounted for almost 45% of the inflation rate, with their contribution being 47% larger than in October 2021 (Chart 1).
Chart 1: Headline inflation and its main components
(annual percentage changes; percentage point contributions)
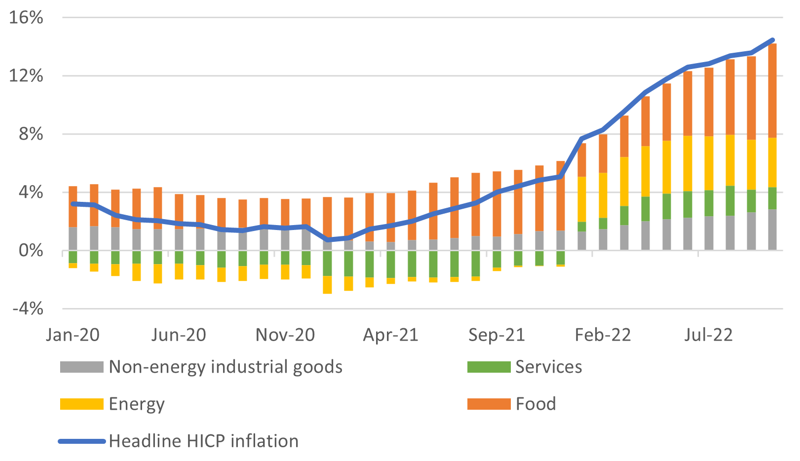
Source: Eurostat and NBS calculations.
Notes: The last observations are for October 2022.
The ability of firms to set a price higher than production costs, that is to charge a markup, is usually a good measure of the amount of market power they wield. Market power is a central indicator when considering the efficiency of an economy, since competitive pressure keeps prices close to production costs, to the benefit of consumers.
The existence of markups per se, however, is not inherently a negative signal, since they are not driven solely by the concentration of market power and a lack of competition. They can also be explained by return on intangible assets (such as investments in R&D), by the need to cover fixed costs or by intertemporal considerations.
Our investigation focuses on the evolution of their distribution over time rather than on their level, since our estimates are bound to be biased by the lack of explicit data on prices and quantities. Ever since the end of the eighties, industrial organization literature consistently estimated markups multiplying the output elasticity of a variable input by the ratio of revenues over the cost of such variable input, the so-called ratio estimator.1 The procedure allows for straightforward estimation of markups once given the elasticity, that is given that the parameters of the production function are known. This empirical exercise builds on well-established and seminal contributions to literature,2 where production function elasticities are estimated using a two-stage iterative GMM procedure. We also rely on some recent analysis of markups estimation techniques3 to deal with our data limitations and choose our econometric specification.
Changes in the empirical density distribution of the markup estimates between the first two quarters of 2015 and 2022 at the more constant NACE1 level hide a more dynamic evolution of the food-related sectors (Chart 2). It is easy to see in Panel A how very little changed in the distribution of markups between 2015 and 2022, with the most notable, albeit still nearly irrelevant, changes happening in the flatter curves characterized by a higher dispersion. The food sectors displayed in Panel B show a more dynamic evolution, with sizable changes between the two periods and an overall shift of the markup distribution in all services to the right. Furthermore, the distributions look generally flatter than their 2015 counterparts, indicating an increased degree of heterogeneity across firms in the same sector.
Chart 2: Estimated markups kernel density
(probability densities; dotted refers to 2015, solid represents 2022)
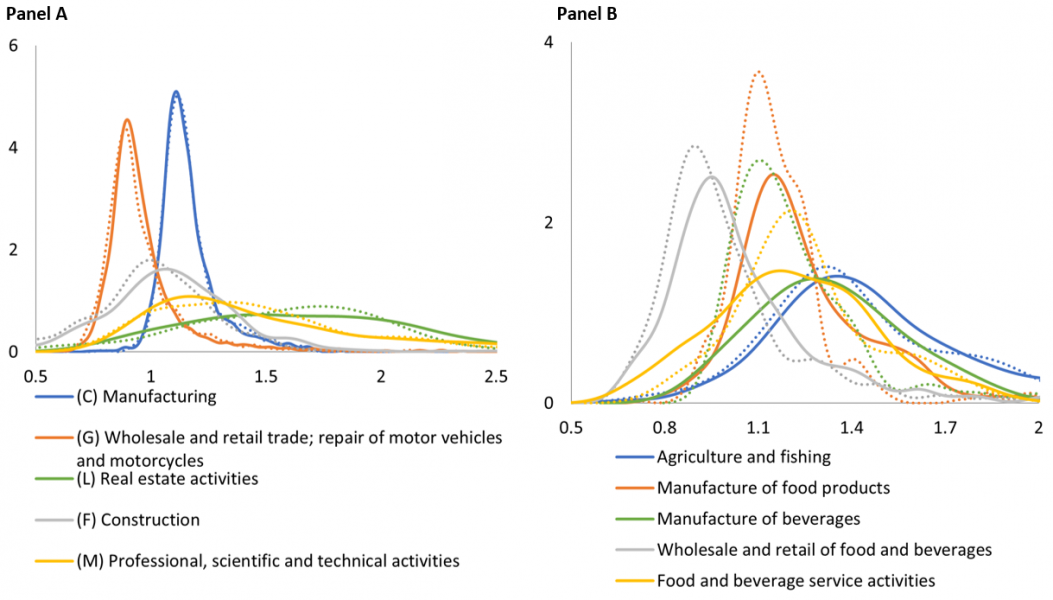
Source: SSO, author’s calculations
Notes: Empirical density estimates of quarterly firm-level markup values of the first two quarter of 2015 and 2022. Data are limited to the five largest industry sectors by share of GVA (ignoring the public sector and Defense expenditure) in Panel A, and to our custom mapping in Panel B. Markups are trimmed to a symmetric 1%. Dotted lines refer to 2015, solid lines represent 2022 densities. Ordinate scale is limited for better readability.
The overall results suggest that firms operating in different areas of the broad food industry have exhibited a pro-cyclical behaviour in 2022, building up a positive contribution to the overall inflationary pressure coming from the food cost component. In the manufacture and the sale sectors the 1H 2022 value added-weighted average markup is higher than the same period average over past years, signalling that revenues have grown more in real terms than the increase in costs would justify (Table 1). We give more weight to larger firms, thus mirroring their larger impact in terms of setting consumer prices and their wider importance in the whole economy and retrieve results overall consistent with the evolution of the unweighted distributions depicted in Chart 2.4
Table 1: GVA-weighted average markup and its percentage variation
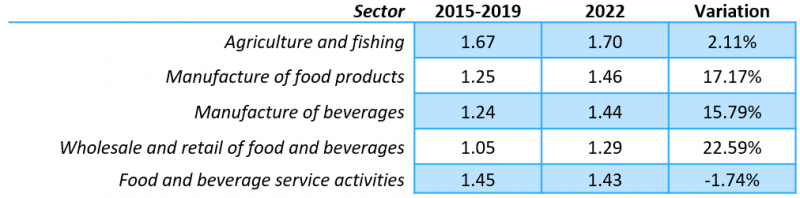
Source: SSO, author’s calculations. Note: The average for the years from 2015 to 2019 has been computed over the first two quarters of every year to match the quarters available in 2022. We disregard the years 2020 and 2021 to void any influence of Covid19-related measures. Sectors consist in a custom mapping of firms at different levels of NACE classification. The T-test null hypothesis of equal means in the two intervals is rejected at 1% confidence levels for all sectors, except Food and beverages service activities, where the test fails to reject at all.
The evolution over time of markups and net revenues of firms in food production and sale chain highlights a certain degree of heterogeneity regarding the increase in margins and the upwards decoupling between price and overall costs (Chart 3). Panel A displays the evolution over time of sectoral average markups, complementing the findings reported in Table 1, and shows how markups in the food manufacture and sales sector have known a positive trend in the first half of 2022. This further confirms that firms over-corrected their prices more than the increase in costs could induced, among others, by the energy factor could justify. Despite the lack of consistent data on profits at quarterly level, Panel B shows estimates of first semester of each year of the total net revenues (as the difference between revenues and total costs) for each food-related sector. Higher markups directly translated in higher net revenues for the food manufacture and the sale sectors, with a more moderate increase for the manufacture of beverages. The agricultural and fishing sector, on the other hand, registered an increase in net revenues not backed by an increase in margin. This result appears to be driven by a substantial increase in both costs and revenues in the first semester of the 2022 (+96% on 1H 2021), rather than by a change in sales volume or in the subsidy structure.5
Chart 3: GVA-weighted average markups and total net revenues
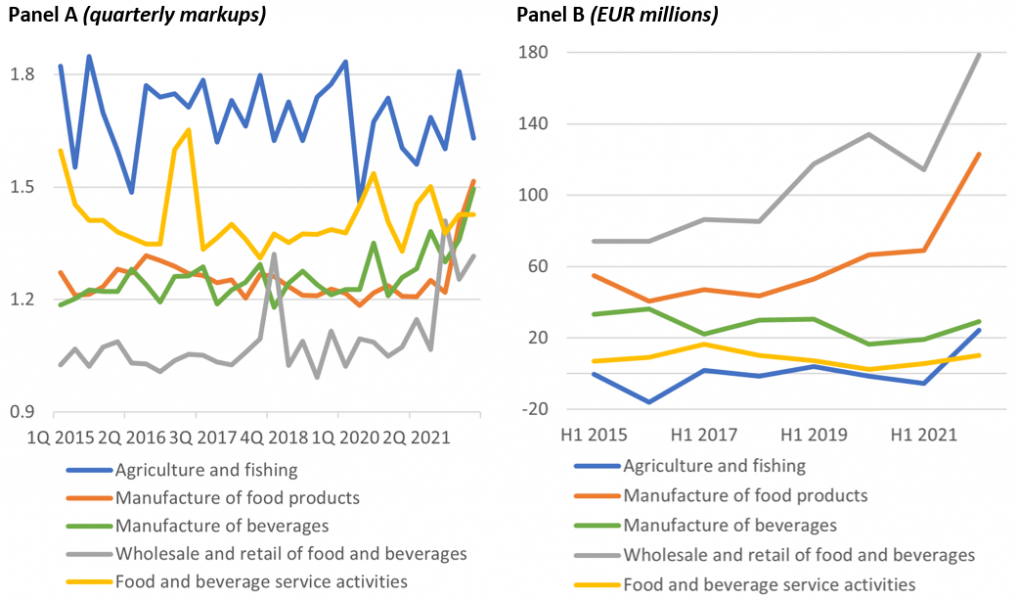
Source: SSO, author’s calculations. Notes: (Panel A) Quarterly value-added-weighted average markup estimate for each sector. Sectors consist in a custom mapping of firms at different levels of NACE classification. Panel B) Total net revenues, computed as the difference between total revenues and total costs, for the first two quarters of each year.
We presented evidence that markups of firms operating in industrial sectors related to the food production and sales chain have grown during the first half of 2022, thus accelerating the food prices component of the HICP inflation.
It would be premature to conclude that firms have liberally pursued a higher degree of market power. Preliminary data for 3Q2022 as well as individual consultations with firms operating in these sectors suggest that intertemporal considerations may have started to play a greater role in their pricing behaviour. In an environment with higher actual and anticipated inflation, compounded by a deep uncertainty about the integrity of supply chains, not only the frequency but also the magnitudes of price increases may have changed relative to past practice. This can manifest itself as higher volatility in markups.
The new environment calls for a stronger commitment to price stability to prevent such pricing behaviour to entrench in the economy, and higher markups volatility to spill over into higher inflation instability. At the same time, a concerted effort by all regulatory and surveillance actors is needed to preclude the structural underlying sources of the volatility from resulting in long-term scars to the efficiency of the economy and to consumer welfare.
R. Hall, “Market Structure and Macroeconomic Fluctuations”, Brookings Papers on Economic Activity, vol. 17, no. 2, pp. 285-338, 1986; R. Hall, “The Relation between Price and Marginal Cost in U.S. Industry”, Journal of Political Economy, vol. 96, no. 5, pp. 921-947, 1988.
A non-exhaustive list includes: De Loecker, J. Eeckhout and G. Unger, “The Rise of Market Power and the Macroeconomic Implications*”, The Quarterly Journal of Economics, vol. 135, no. 2, pp. 561-644, 2020; D. Ackerberg, K. Caves and G. Frazer, “Identification Properties of Recent Production Function Estimators”, Econometrica, vol. 83, no. 6, pp. 2411-2451, 2015; J. Loecker and F. Warzynski, “Markups and Firm-Level Export Status”, American Economic Review, vol. 102, no. 6, pp. 2437-2471, 2012.
Sources M. De Ridder, B. Grassi and G. Morzenti, “The Hitchhiker’s Guide to Markup Estimation”, CEPR Press Discussion Paper, no. 17532, 2022.
Intuitively, a similar result can be achieved weighting the results by revenues. This approach, however, is at direct risk of “double counting” due to the estimation technique used.
The Report on Agriculture and Food Sector in the Slovak Republic for 2020 – Green Report estimates that the share of the total subsidies in revenues is as high as 30.1%.