menu
close

Author(s):

Juhana Hukkinen | Bank of Finland
Matti Viren | Bank of Finland

Keywords:

inflation , inflation expectations , energy prices

JEL Codes:

D22 , E31 , F41

All opinions expressed here are our own and do not necessarily reflect those of Bank of Finland or the Eurosystem.

We are accustomed to the idea that expectations play a crucial role in macroeconomics. This concept has been particularly evident in the study of inflation, where expected inflation has been the main determining factor in empirical analyses using the Phillips curve. In contrast, real variables such as output or unemployment have had little significance. However, recent inflation trends have challenged this notion. Measures of expected inflation have proven to be unreliable in predicting future inflation movements. Furthermore, forecast errors were initially dismissed as temporary, leading both policymakers and forecasters to overlook the issue. This paper examines the reasons for this failure, focusing on supply-side shocks that have impacted inflation but have not been accounted for in traditional Phillips curve models.

Expectations are (not necessarily) everything

Recently, economists have voiced growing criticism of the standard New-Keynesian Phillips curve, which has been the main analytical tool in macroeconomics. The criticism has particularly focused on the use of inflation expectations as an independent variable, even though it is widely recognized that expectations are influenced by various factors and Central Bank communication and there is no consensus on how to model them (see, for example, Rudd (2020 & 2024) and Werning (2024)). Inflation expectations appeared to add value to inflation predictions before the Covid-19 pandemic, when inflation rates remained relatively stable. However, when inflation surged in 2021, inflation expectations failed to signal the sharp increase and instead lagged behind.1 Furthermore, after inflation peaked in early 2022, inflation expectations quickly reverted to pre-pandemic levels. Central banks, relying on inflation expectations data, used the behavior of these expectations as a justification for delaying their response to actual inflation numbers until late 2021 and early 2022.

The apparently strong performance of inflation expectations before the Covid-19 pandemic masked some peculiarities in various proxies of inflation expectations. Firstly, there were noticeable differences in levels among different proxies, especially between data collected from households and firms, as well as between professional forecasters and the general public. Looking back, data from professional forecasters displayed certain questionable characteristics, consistently deviating by a small margin from the two percent policy target over the past few decades, particularly in regard to long-term inflation expectations.

One could argue that survey data is inherently unreliable in gauging future expectations (see Kydland and Prescott 1977), but historical trends have shown that various market-based measures have not fared much better. The reason for this is not immediately clear, but one could speculate that extensive central bank interventions in the form of quantitative easing (QE) have essentially distorted the information derived from financial asset returns.

Nature of differences between actual and expected inflation

In Table 1, we demonstrate the inability of inflation expectations to accurately predict the magnitude of the inflation shock during the period of 2021-2023, with a focus on data from both the Euro area and the United States. A visual representation of this analysis is provided in Figure 1. Additional detailed insights into the time series behavior can be found in Figures 2-3.

Table 1: Inflation expectations of the Euro area and the U.S.

Notes: The expectation data presented represents values for either one year or 12 months ahead from the respective month. “E” indicates the Euro area, “U” indicates the USA, “con” represents data from the consumer survey, and “ind” represents data from the industry survey conducted by the European Commission. “spf” represents data from the survey of professional forecasters for the time horizons of 1 year and 5 years. The term “Swap” indicates expectations derived from Swap prices, “CS” represents values from the Consensus forecast, and “Mich” indicates data from the Michigan inflation survey. EHICP (UCPI) denotes the actual annual inflation rate for the Euro area (USA).

Figure 1: Graphic summary of one-year forecasts of 2021-2023

Figure 2: Realized inflation and consumer expectations in the Euro area
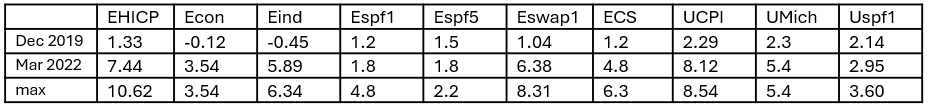
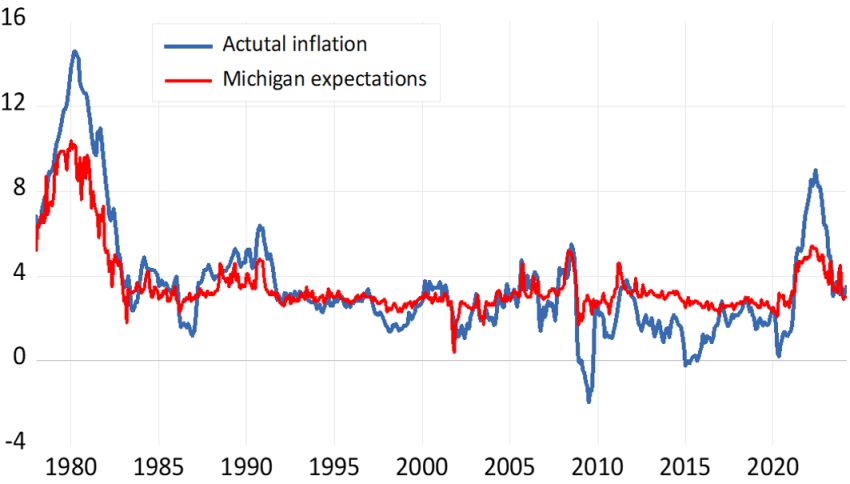
Notes: Inflation denotes HICP inflation in the Euro area and expected inflation the corresponding excess share of respondents in EU commission consumer survey expecting an increase in the price level during the next 12 months.
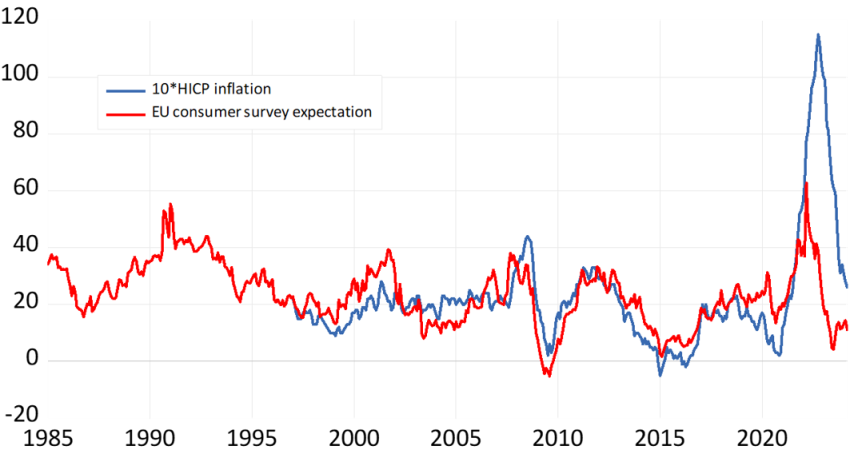
The results from the comparison of various variables clearly indicate significant discrepancies in the values provided by different sources. All forecasts fall short of the actual values, particularly in terms of peak or maximum inflation values, let alone capturing the precise inflation profile. Only the survey data derived from the industry come close to the realized values of inflation, but one has to keep in mind that producer prices’ inflation exceeded 30 per cent in 2022. In this respect, firms’ expectations did not perform any better than those of households (Figure 3), rather the opposite. Household expectations seem to perform extremely well “in normal times” but in 2022 and 2023, the data suggest that high inflation is over in a matter of one or two months.

Figure 3: The Michigan inflation expectations series and actual US inflation

The survey conducted among professional forecasters (SPF) failed in both the Euro area and the US to anticipate the upcoming inflation, with very little indication in the long-term expectations. It seems that forecasters may have anticipated a very short-lived inflationary episode. Additionally, it is perplexing that market-based expectations were unable to capture the rapid rise in inflation. The sustained nature of inflation proved to be a challenge for all market-based forecasts.

One of the most concerning aspects of inflation expectations is the consistently steady level of average predictions, as depicted in Figure 3, particularly evident in the University of Michigan expectations series. In both the periods of 1979-1980 and 2022-2023, there was a significant underestimation of the inflation peaks. Furthermore, the deflation episode of 2009-2010 was also overlooked. This failure is further highlighted by the very low correlation coefficients and the erratic behavior of the regression coefficient when analyzing the relationship between realized inflation and the corresponding predicted values, as shown in Figure 4.

Figure 4: Rolling 60-month regression between inflation and the Michigan inflation expectations’ series

The major issue with inflation expectations lies in the uncertainty surrounding the mechanism and the information upon which the surveyed values are based. Werning (2024) proposed that expectations could potentially be founded on a very limited amount of information, such as the price of gasoline. Figure 5 suggests that this interpretation is indeed plausible, at least in the case of the US. A similar relationship is observed for the Euro Area, although it appears somewhat weaker.

Figure 5: US inflation expectations and the price of gasoline

Firms versus households

Finally, it would be insightful to examine producer prices, as they may provide more informative insights into the fundamental nature of inflation compared to consumer prices (refer to Figure 6). For example, consider the New Keynesian Phillips curve as a starting point for analysis. In this framework, we are concerned with firms’ pricing decisions rather than consumers’ reactions. It raises the question of why firms would be influenced by households’ price expectations for consumption. Most likely, consumer price expectations are utilized simply because they are readily available, and central banks’ policy objectives are linked to consumer prices.

Turning our attention to European data, we observe that producer prices clearly lead (and act as a Granger causal factor for consumer prices), showing an increase at least three times greater than consumer prices. Additionally, the discrepancy in inflation rates among producer prices across different countries is notably smaller compared to the variation seen in consumer prices.2 This disparity is largely attributed to external energy and supply shocks impacting Western economies. Consequently, it is not surprising that these external factors are not reflected in the formation of consumer price expectations.

Figure 6: Producer and consumer price inflation in the Euro area 1997M1-2024M3

Concluding remarks

It is undeniable that expectations play a crucial role in economic analysis. However, this does not imply that empirical proxies of variables such as inflation expectations should be interpreted as accurate reflections of the underlying theoretical concept. The significant discrepancies among different variables, particularly in cases of non-normal inflation values, should serve as a warning sign regarding the ambiguity surrounding the measures’ contents. In the period of 2021-2023, the primary drivers of inflation appear to stem largely from energy prices, or more broadly, from supply shocks that are not easily predictable within a rational expectations framework. It is unsurprising, then, that policies based on historical data and behavioral patterns from relatively stable environments led to a substantial underestimation of the effects of these shocks.

References

Gorodnichenko, Y. (2024) Yuriy Gorodnichenko on Inflation Expectations. In Markus’ Academy. https://www.youtube.com/watch?v=rgzFKV4LFB0.

Kydland, F. and ED. Prescott (1977) Rules rather than discretion. Journal of Political Economy 85, 473-492.

Rudd, J. (2021) Why Do We Think That Inflation Expectations Matter for Inflation? (And Should We?): Federal Reserve Board. Finance and Economics Discussion Series 2021-62.
https://www.federalreserve.gov/econres/feds/files/2021062pap.pdf.

Rudd, J. (2024) Practical Guide to Macroeconomics. Cambridge University Press.

Werning, I. (2024) Speech at the American Economic Association 2024 Winter meeting Lunch Seminar. https://www.aeaweb.org/webcasts/2024/aea-afa-luncheon.

  • 1.

    Also the very large cross-country differences are puzzling from the perspective inflation expectations. The maximum 12-month inflation rate in the Euro area/EU (Estonia/Hungary) for 2021M1-2024M3 was 25.2/26.2 % and the minimum (France) 7.3 %.

  • 2.

    For the period 2019-2024, the coefficient of cross-country variation of producer prices (consumer prices) was 0.28 (1.12).

About the authors

Juhana Hukkinen

Juhana Hukkinen is an advisor at the Bank of Finland. He has worked at the Bank of Finland since 1987. He made his studies at the University of Helsinki, first philosophy and then economics. Most of his work and research is related to monetary and fiscal policy and applied macroeconomic analysis.

Matti Viren

Matti Viren is professor of economics (emeritus) at the University of Turku and consultant at the Bank of Finland. Earlier he has served as a research supervisor at the Bank of Finland and as research director at the Government Institute of Economic Research. He has also been the Pre-accession advisor at the Polish Ministry of Finance in 2001-2003. He made his graduate studies at the Universities of Helsinki and Chicago and received his doctorate at University of Helsinki in 1980. Most of his research is related to economic policy and applied macroeconomic analysis.

More on these topics

Tags: