

All opinions expressed here are our own and do not necessarily reflect those of Bank of Finland or the Eurosystem.
Recent inflation does not seem to correspond to the textbook illustration of inflation, in the sense that it is very hard to detect a Phillips curve relationship between inflation and real variables, such as unemployment and output. Until recently, the time paths of these real variables have been almost constant, suggesting that in order to explain inflation developments, there should have been significant shifts in the slopes of the Phillips curve. That might be the case, but the puzzling feature is that the relationships have become weak, and the explanatory power of time series empirical models is very low. This is not limited to the 2021-2023 period. In this environment, it is difficult to assess how policy actions have contributed to the surge of inflation and similarly to the recent downfall of inflation.
Recent inflation has been quite extraordinary, as the reasons for the surge in 2021 remain unclear. Similarly, it’s not clear why inflation rates have come down so rapidly. This uncertainty underscores the absence of a uniform theory of inflation. Instead, we confront various alternative viewpoints, ranging from monetary developments and excess demand in goods and labor markets to changes in inflation expectations and the loss of central bank credibility. Regardless of the viewpoint, we would expect some relationship between inflation and the real economy, typically manifesting in the Phillips curve, where there is a negative trade-off between unemployment and inflation. Even though this relationship is believed to depend on expectations of the future path of inflation, we should still anticipate that the slope of the curve remains rather invariant across different economic situations and that this slope can be identified from existing data.1
The problem arises when inflation appears unresponsive to developments in output and employment. In such cases, assessing how economic policy tools influence inflation becomes challenging because key policy instruments, like the policy interest rate, impact inflation indirectly—only through their effects on market conditions, such as creating slack in the economy. As we observe below, in recent years, this relationship has been, at best, very weak. This is not surprising, considering the findings of scholars such as Stock and Watson (2016), who suggest that the cyclical relationship between inflation and real variables has progressively weakened over time in the U.S. Also Ari et al. (2023) find the relationship quite fragile even for the recent past.
First, let’s examine some descriptive data regarding the relationship between inflation and real variables using alternative datasets. We start with Euro area microdata covering the period from December 2016 to September 2023, including 280 price indexes for main commodity groups (refer to Hukkinen and Viren 2023 for details). The relationship between annual inflation and unemployment (as well as the unemployment gap) is illustrated in Figure 1. Figure 2 presents these variables using Euro area aggregate data. In addition to the time series of inflation and unemployment, we include one-year-ahead inflation expectations from the survey of ECB professional forecasters (SPF). The third set of evidence comes from 22 industrialized countries, covering the period from January 1975 to September 2023 (depicted in Figure 3).
Figure 1: Euro area micro data for inflation and unemployment
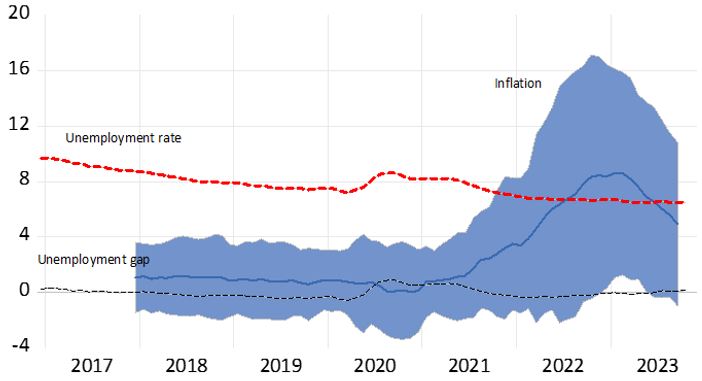
Figure 2: Evidence from Euro area quarterly data
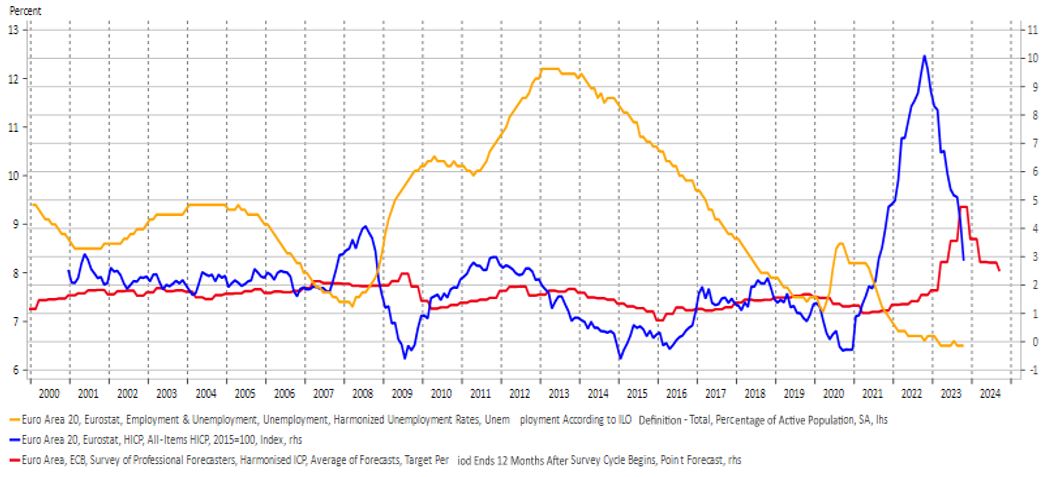
Figure 3: Evidence from global monthly data
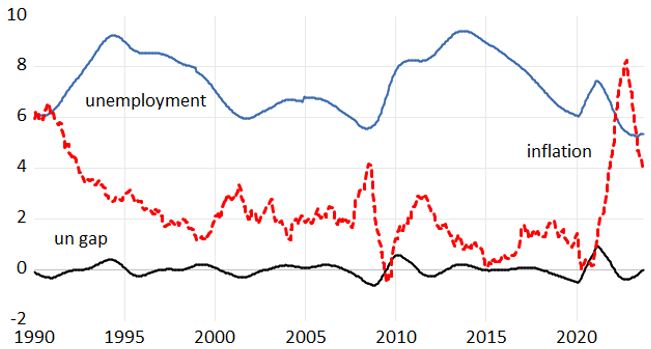
Figures 1-3 tell the same story. Inflation appears largely unrelated to unemployment, and this holds true for output, regardless of how the respective time series are filtered. The most notable discrepancy is observed in the 2021-2023 period, where both unemployment and the output gap fail to correlate with inflation. Another striking feature is that inflation expectations provide no warning signals of impending inflation before 2021-2022. This is consistent with findings in numerous studies e.g. in Blot et al (2022) and Levy (2023).
The nature of the eventual relationship between inflation and real variables was further scrutinized using a similar approach as in Stock and Watson (2021), by comparing the cyclical changes of inflation, unemployment, and output (with the latter variables utilizing filtered gap measures). To delve deeper, we divided the data into two subsamples covering the most recent years and the more distant past. The results for the last ten years (2013-2023) and the periods preceding 2013 are reported in Table 1.
The results of the bivariate analysis can be summarized quite easily: a general observation is that the bivariate relationship is very weak. The relationship for the recent years is practically nonexistent, and in several cases, it shows the wrong sign. While the relationship for the earlier period makes more sense, the statistical quality of the relationship is rather poor. This also showed up when we estimated rolling regressions with different time windows between inflation and the gap variables: in practically all cases with the panel data the hypothesis of parameter stability could be rejected with levels of significance. It is not surprising that when we attempt to forecast inflation using this relationship, we fail to capture the recent inflation spike. The start of war in Ukraine is the only thing which seems to have affected inflation and real economy expectations in early 2022. After that inflation expectations are completely unrelated of unemployment.
Table 1: Change in the relationship between inflation and real variables

Notes: Table 1 provides regression coefficients between the four-quarter change in four-quarter inflation (i.e., the yoy inflation rate dkinfkt, where infk is a k-period moving average of one period inflation rates) and gapk that is a k-period moving average of six unemployment or output gap measures. The boundary between periods is either 2013Q3 or 2013M9. None of the coefficients reached significance at the 5% level. The global dataset has 12,870 data points for 22 industrialized countries, and the Euro area dataset has 124 data points. The panel data analysis includes cross-section fixed effects.
The weakness of the bivariate relationship also shows up in Figure 4. After February 2022 (start of the Ukraine war), inflation and unemployment expectations are completely unrelated. With general economic conditions, the relationship makes more sense but in 2023, the co-movements are extremely small. Much better predictions are obtained if we use indicators of energy prices, as shown in Figure 5.
Figure 4: Consumer forecasts for inflation and economic conditions/unemployment
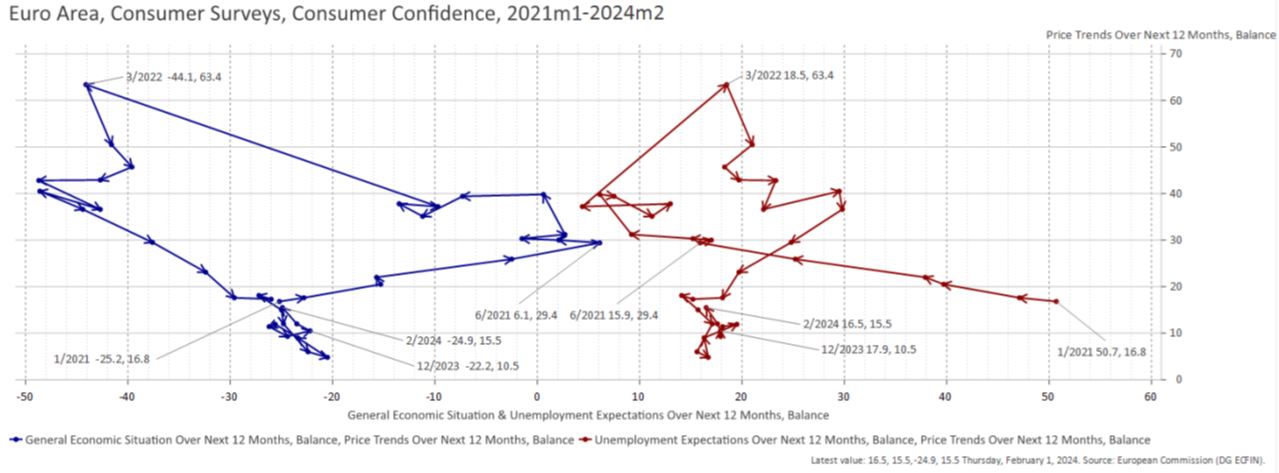
Notes: The y-axis stands for inflation and the x-axis for general economic conditions (left-hand side panel) or unemployment (right-hand side panel). The values correspond to the percentage differenece between “will increase” and “will decrease” answers.
Figure 5: The change rate of consumer and energy prices for the Euro Area
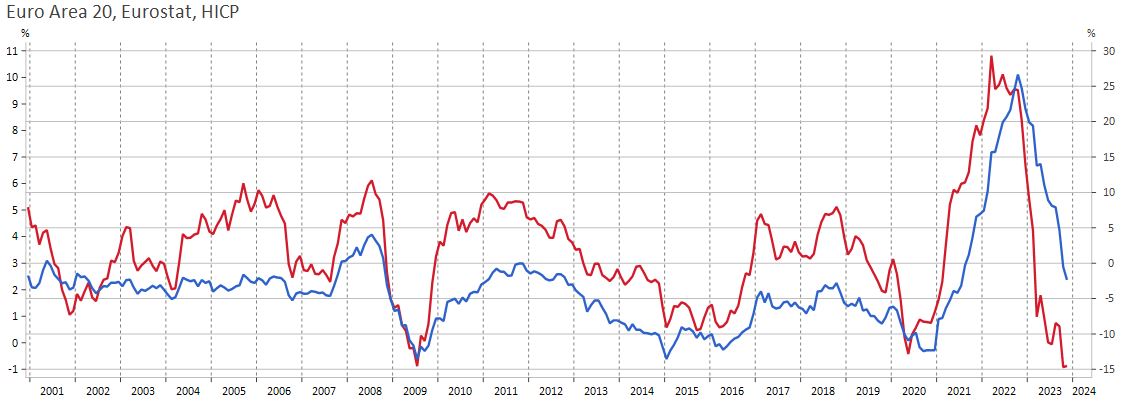
Notes: The Granger causality test shows without any doubt (with marginal probabilities 0.002 and 0.730, respectively) that energy prices lead other commodity prices. That is particularly obvious for the 2021-2023 period.
The message from the data is quite clear: recent inflation developments appear to be largely independent of changes in unemployment and output. The link to inflation expectations is, at best, very weak. Instead, it seems that the developments in 2021-2023 reflect similar features (including similar lead-lag relationships) to the oil crises in the 1970s (see Figure 6). This does not imply, of course, that all other variables such as shipping costs (Carriere-Swallow et al 2023) have been irrelevant in terms of both the surge and the downfall of inflation, not to mention the causal factors behind oil/energy prices. Even if energy now is different from energy in the 1970s, it has come out as a similar negative supply shock as the oil shocks in the 1970s. However, when considering key determinants of aggregate supply and demand, very few traces of an overheated economy or, more recently, signs of a depression are found. This also means that, for now, it is very difficult to determine the role of interest rate policies or monetary policies in general. A further complication is the fact that the real interest rate has been negative until recent days, so we have not witnessed anything akin to the ‘Volcker shock’ in monetary policy tightening, even though some policy interest rate hikes have been interpreted as such.
Figure 6: Previous and current energy price shocks and inflation
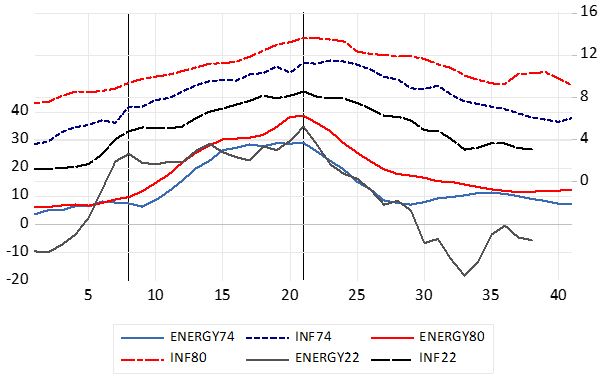
Notes: The time series are for the annual growth rates of consumer prices INF and energy prices ENERGY in the U.S. With all series, a 40-month time window is used so that the peak in energy price growth rate is set to be the same for all three cases (1974, 1980 and 2022).
Ari, A., D. Garci-Macia and S. Mishra (2023) Has the Phillips curve become steeper? IMF Working Paper 100. https://www.elibrary.imf.org/view/journals/001/2023/100/article-A001-en.xml.
Blot, C., C. Bozou and J. Creel (2022) Inflation expectations in the euro area: trends and policy considerations. In-depth analysis requested by the econ committee. Monetary dialogue papers. European Parliament. https://www.europarl.europa.eu/RegData/etudes/IDAN/2022/703341/IPOL_IDA(2022)703341_EN.pdf.
Carriere-Swallow, Y., P. Deb, D. Furceri, D. Jimenez and J. Ostry (2023) Shipping costs and Inflation. Journal of International Money and Finance 130, https://www.sciencedirect.com/science/article/pii/S0261560622001747.
Hukkinen, J. and M. Viren (2023) Does inflation come and go in the same way? Aboa Centre for Economics Discussion paper No.163. https://ace-economics.fi/kuvat/dp163.pdf.
Levy, M. (2023) The Fed: Bad Forecasts and Misguided Monetary Policy. Hoover Monetary Policy Conference Paper. Hoover Institution, Stanford University. https://www.hoover.org/sites/default/files/2023-05/Hoover%20Monetary%20Policy%20Conference%20May%2012%202023%202-1.pdf.
Rudd, J. (2021) Why Do We Think That Inflation Expectations Matter for Inflation? (And Should We?): Federal Reserve Board. Finance and Economics Discussion Series 2021-62. https://www.federalreserve.gov/econres/feds/files/2021062pap.pdf.
Stock, J. and M. Watson (2021) Slack and cyclically sensitive inflation. Journal of Money, Credit and Banking. https://doi.org/10.1111/jmcb.12757.
Recently, there has been a lot of controversy regarding the usefulness of the Phillips curve in analyzing inflation developments. See, for example, Rudd (2021), who presents a very critical view. See also Ari et al (2023) who conclude that “Taking our Phillips curve slope estimates at face value, plausible levels of excess demand would be unable to entirely explain the recent surge in inflation”.